
The product / Red Line Burndown
Great teams.
Clearer insights.
Plan with realistic capacity. Track progress from every angle. Understand the Jira changes behind the chart.
Ready for the new Jira dashboards. Use supported dashboard filters and preview configuration changes before saving. Classic Jira dashboards are supported too.
01 / Capacity planning
A plan grounded in capacity.
The Red Line Burndown was built on the premise that understanding your resource model and how a project is progressing against the assumptions in that resource model are critical to project execution. When projects cross the point of no return – when they cross the Red Line – teams are left with few options to bring the project back on track.
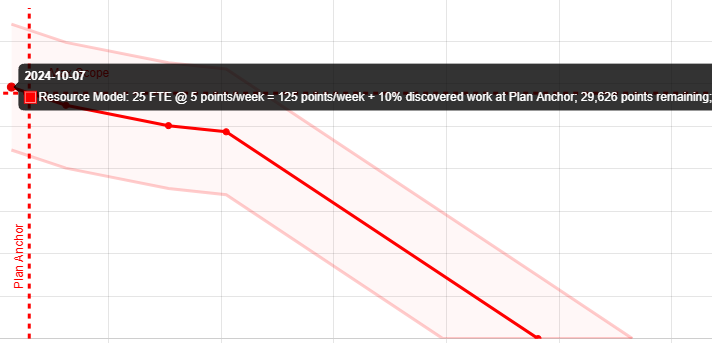
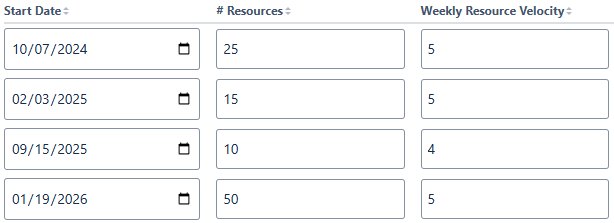
We set out to make it easy to define and visualize the resource model for a project along with error bars to account for the natural uncertainty that exists in all projects. Users can define the Plan Anchor date that represents when the project scope was finalized for tracking. All resource model assumptions are tied to this date.
Whether you’re working with story points or time-based projects, the Red Line Burndown makes it easy to understand whether the project is on track to stay within the boundaries of those resource model assumptions or it’s on a path to cross the red line.
02 / Project tracking
One project. Multiple perspectives.
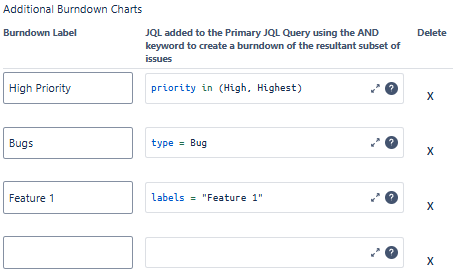
Our first of a kind feature enables teams to visualize multiple burndowns on the same chart. This is especially valuable when analyzing past performance, understanding where the project is on-track and where there are critical issues lurking.
Each Additional Burndown is constructed by using a logical AND operator to identify the issues that exist in both the Primary Filter or JQL Query AND this additional burndown – aka it shows the subset of issues from the original query that match the Additional Burndown query.
03 / Change analysis
Understand every change.
One of the most difficult things to figure out when looking at a burndown is which changes are contributing to major increases or decreases in the remaining work left in the project.
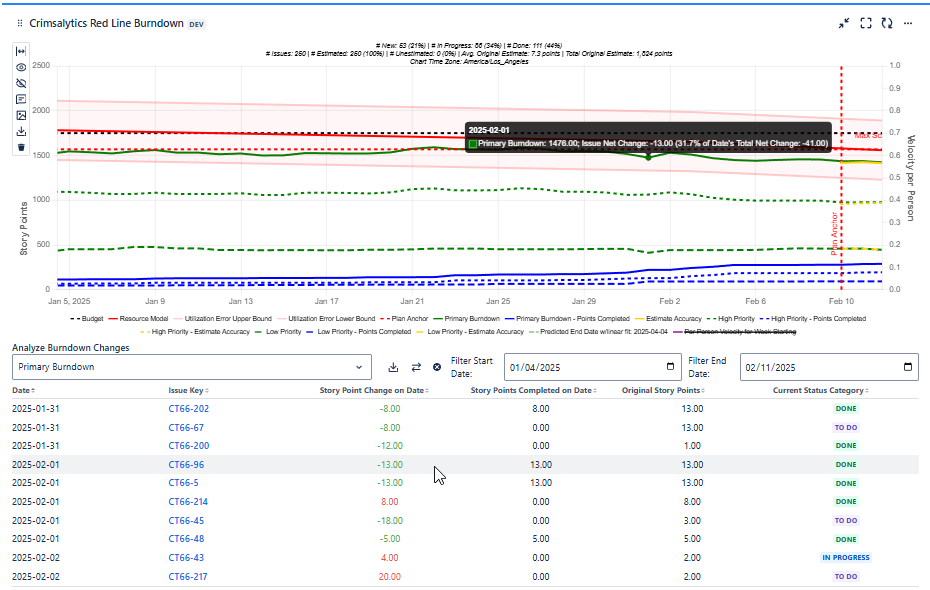
We tackled this problem by calculating the net change for every single issue in the burndown on every single date. These changes are presented in a sortable table below the burndown. Users can filter the table by zooming in on the chart or manually selecting start and end dates. Each series displayed on the chart can be selected for analysis.
Clicking on a row in the table instantly pops the tooltip on the chart so you can quickly identify from both the chart and the table how changes are affecting the project. Red text indicates increases in remaining scope and green indicates decreases.
04 / Team performance
Measure your actual pace.
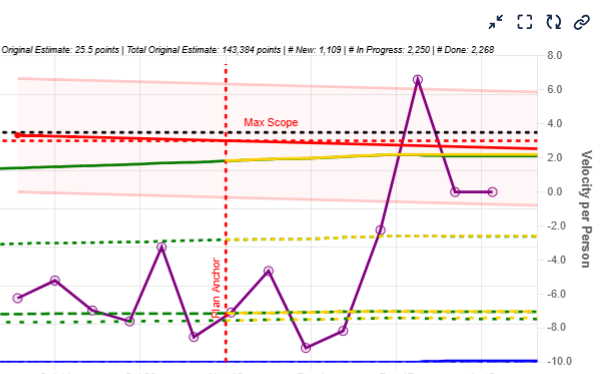
Calculating velocity or utilization over time often involves downloading data, performing analysis, and sometimes iterating multiple times. We calculate the per developer velocity (story point mode) or average utilization (time-based mode) on a weekly basis and overlay that as a series on the chart so that you can easily see how your team is performing against the assumptions in your resource model.
05 / Backlog metrics
Know your backlog’s health.
Have you ever scrutinized a burndown chart only to later realize that a significant number of the issues lacked an estimate? At the top of the Red Line Burndown chart, a set of metrics makes it easy to understand current backlog health. How many tickets aren’t estimated, what’s the average estimate, how many issues are in each status?

06 / Milestones
Keep key dates in view.
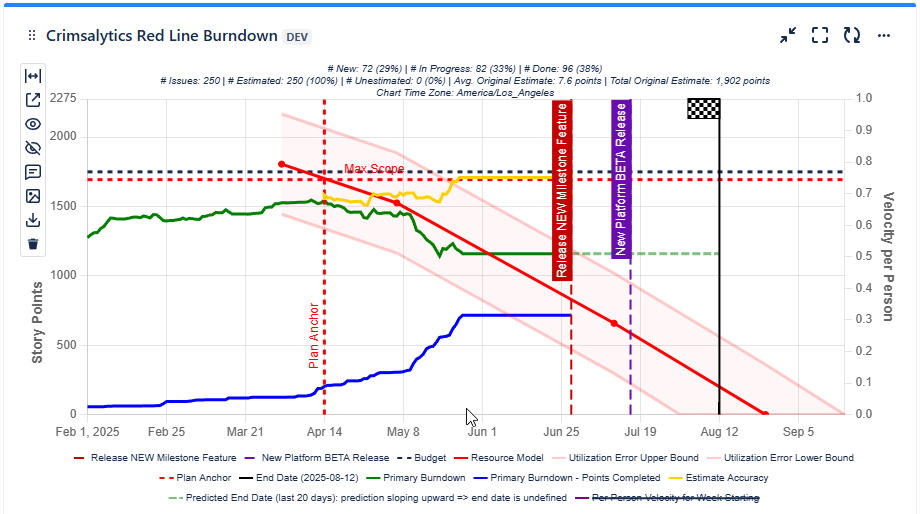
Keep your team and stakeholders aligned by clearly visualizing key project dates directly on the chart. Milestones appear as flag icons with user-defined labels, while the project end date is marked with a distinctive checkered flag. This makes it easy to communicate progress, expectations, and deadlines at a glance.
07 / CSV export
Your data. Ready to explore.
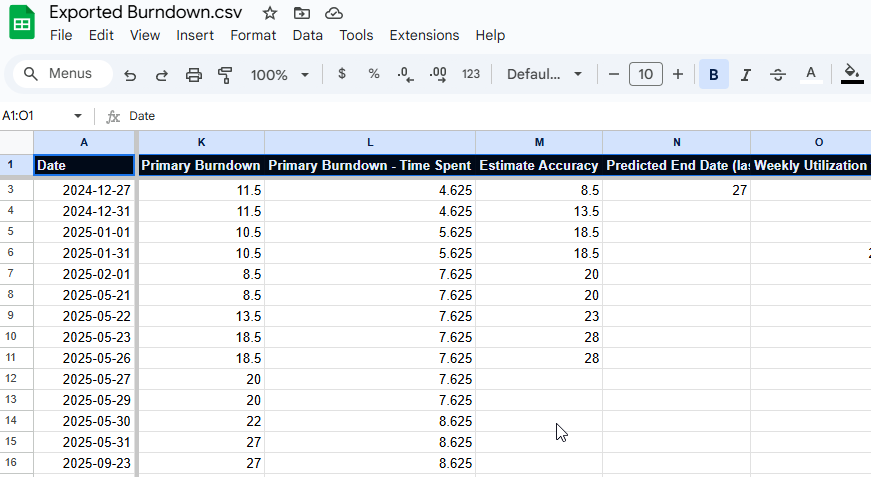
- Users can download all the series data as csv with a single click
- Analyze Burndown Changes data can also be downloaded as csv
08 / Data and privacy
At home on Atlassian.
Data for this app is stored in each customer’s Atlassian Cloud instance, which means the app is:
- Hosted on Atlassian
- Data stored within Atlassian
- Data residency compliant

Better delivery starts with visibility